
नीचे दिए गए रेखाचित्र में निम्नलिखित में से कौन-सी परिघटना सही ढंग से दर्शाई गई है?
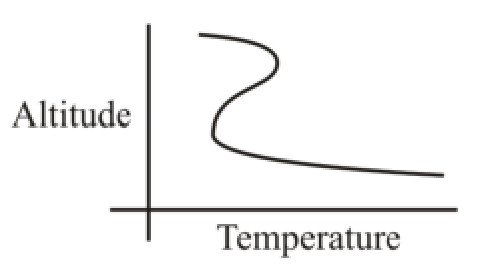
Aसामान्य ह्रास दर
Bऊपरी सतह प्रतिलोमन
Cनिचली सतह प्रतिलोमन
Dपर्यावरणीय ह्रास दर
🔒 Answer hidden — practise on Mcqkart to check yourself and see the explanation.
Want more like this? Create a free account to practise a full test, track your progress, and get spaced-repetition review.
Practise on Mcqkart →🎓 Book an expert →