
The given figure showing Market, Threshold and Range explains which one of the following models?
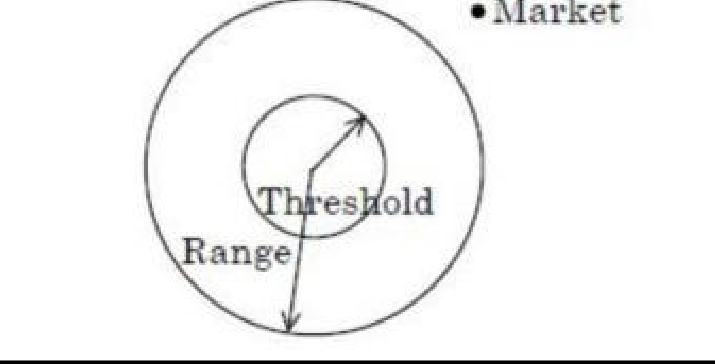
AWeberian model
BCentral Place model
CVon Thunen model
DGravity model
🔒 Answer hidden — practise on Mcqkart to check yourself and see the explanation.
Want more like this? Create a free account to practise a full test, track your progress, and get spaced-repetition review.
Practise on Mcqkart →🎓 Book an expert →