
Geography · Geography of Economic Activities and Regional DevelopmentUGC NET June 2023 Geography Paper II
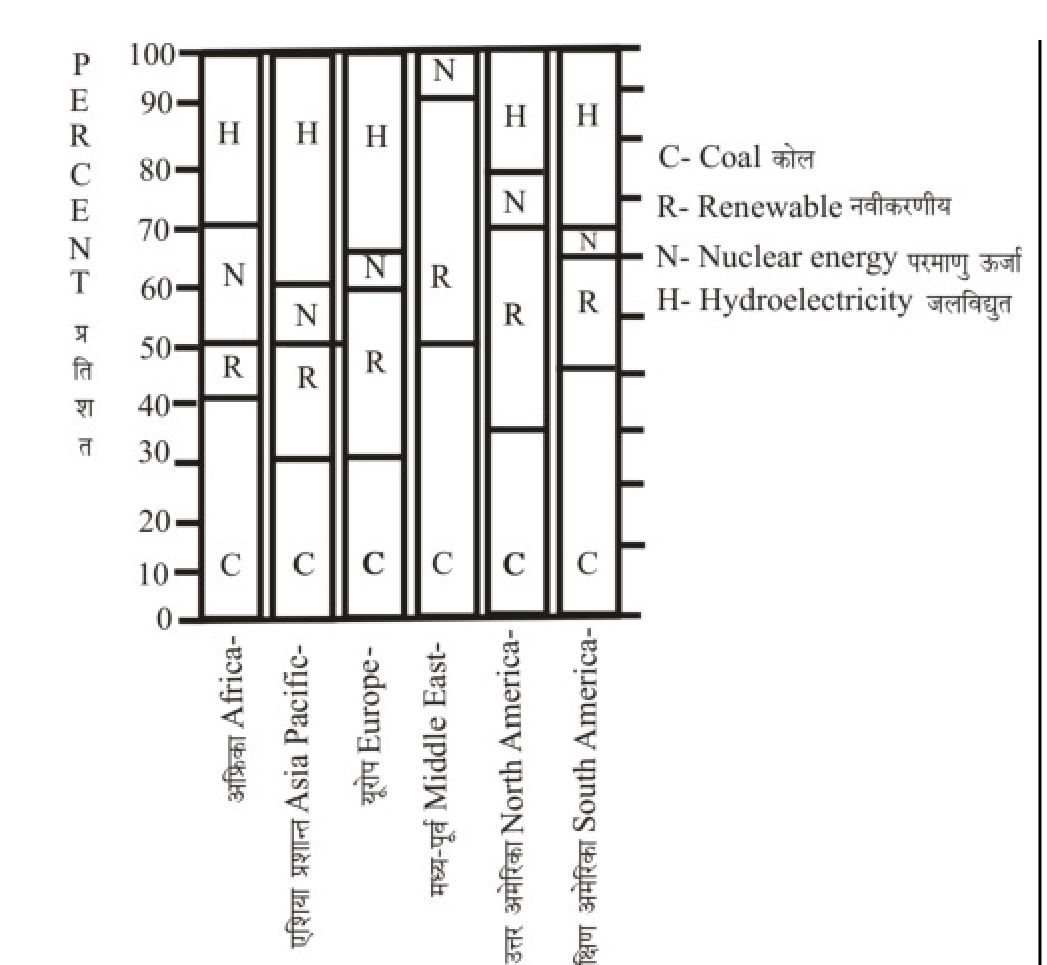
हिन्दी में पढ़ें →The given figure shows the regional consumption pattern of energy from various sources for six world regions, where C is Coal, R is Renewable, N is Nuclear energy and H is Hydroelectricity. On the basis of the figure, in which region is the combined consumption of renewables and hydroelectricity the highest?
AAfrica
BNorth America
CAsia Pacific
DEurope
🔒 Answer hidden — practise on Mcqkart to check yourself and see the explanation.
Want more like this? Create a free account to practise a full test, track your progress, and get spaced-repetition review.
Practise on Mcqkart →🎓 Book an expert →